DNA & RNA Structure and Helical Parameters Analyses (NAFlex)
----Tutorial 2 -- Global analysis (XCGY)
Tutorial 3 -- Meta-trajectory (XCGY)
Tutorial 4 -- Experimental vs MD analysis
----
One possible validation of our nucleic acid simulations is the direct comparison with experimental information. Unfortunately, in the majority of the cases, we can just compare with one single structure deposited in the PDB database, losing the nucleic acid intrinsic flexibility. However, in a small number of cases, the PDB has more than one structure corresponding to the same nucleic sequence. Here, if we are able to join together these structures, we would be able to reproduce the experimental flexibility observed, and thus compare it to the information obtained through our MD simulations.
For that, we built a pipeline to automatically generate all the possible nucleic acids experimental trajectories from the PDB database, and obtain a set of helical parameters using Curves+ program.
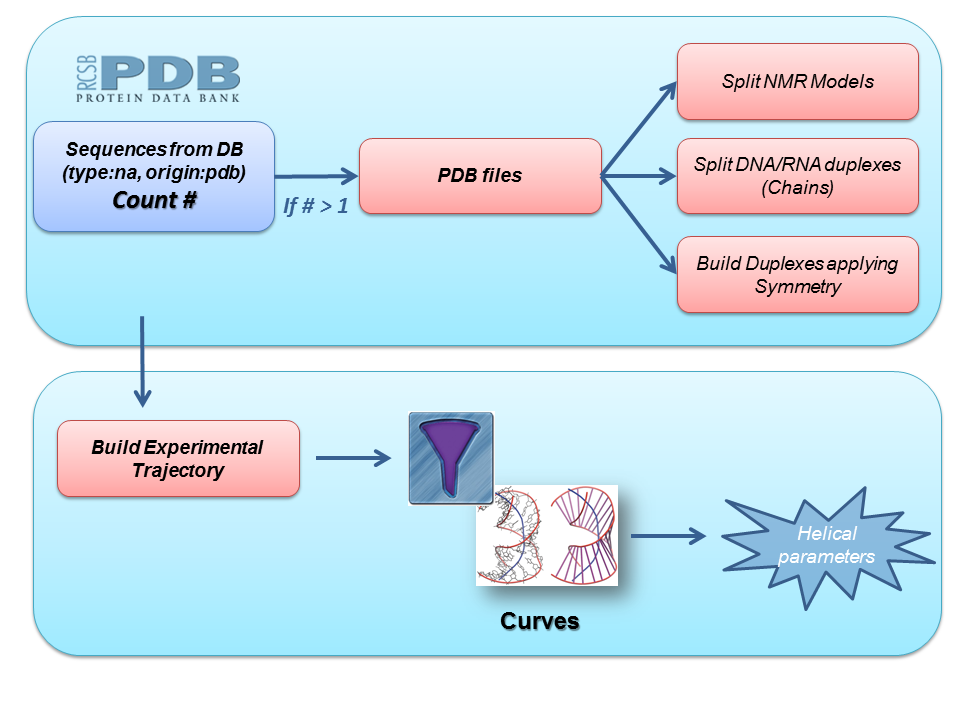
Starting from all the PDB files including a particular nucleic acid sequence, we built a complete dataset of duplex structures for this sequence following these steps:
Next step in the pipeline consists in applying a list of filters to the set of duplex nucleic acid structures obtained. These filters work as a pre-process to the analyses we are interested in, and include, for example, checking for different strand lenghts, possible sequence mismatches, presence of essential atoms needed for subsequent analyses, etc. With these duplex structures, an experimental trajectory is built, joining together all the information and building the corresponding topology file. Finally, Curves+ program is run with this trajectory as input file to extract experimental helical parameters information.
The following table shows all sequences in the PDB database for which we could generate an experimental trajectory.
| Sequence | PDB entries / structures* | BIGNASim | Comparison Analysis |
| CGCGAATTCGCG (DDD) | 184 / 106 |  | |
| CGTACG | 46 / 20 | | |
| GGCGCC | 14 / 7 | | |
| CGCAAATTTGCG | 13 / 21 | | |
| CCCCGGGG | 6 / 2 | | |
| CCTCTGGTCTCC | 7 / 19 | | |
| CCTCAGGCCTCC | 6 / 48 | | |
| CTCGGCGCCATC | 5 / 38 | | |
| GGATATATCC | 2 / 22 | | |
| GCAAAATTTTGC | 1 / 9 | | |
| CACCCTTTGAAGCTC | 1 / 12 | | |
| CGCATGCTACGC | 1 / 10 | | |
| GGCAAAAAACGG | 1 / 10 | | |
| GGCAAGAAACGG | 1 / 10 | |
* Some of the PDB files contain more than one nucleic acid duplex structure (e.g. NMR models).
In those MD simulations whose nucleic acid sequence has an experimental trajectory generated, a new analysis interface is created, with values and plots containing the comparison between experimental and simulation information. Analyses shown are average values for Backbone torsions, Axis Base Pair, Intra-Base Pair Helical Parameters and Inter-Base Pair Parameters.
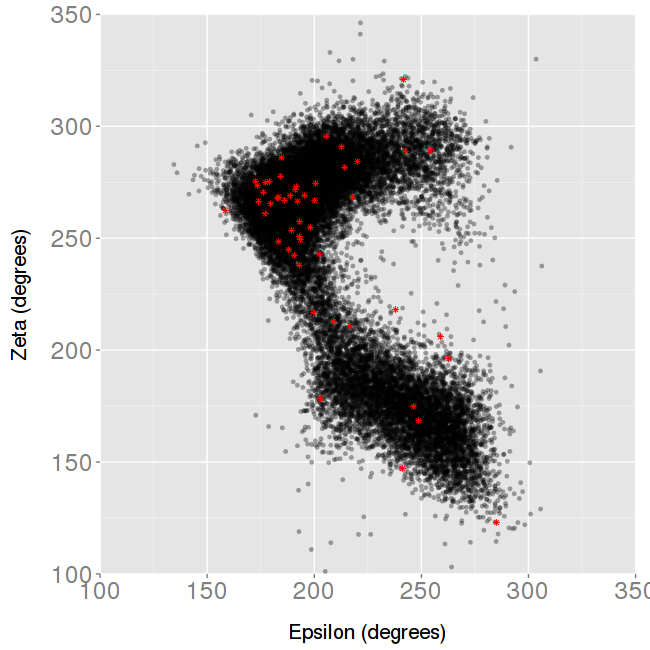
For the Backbone torsions analysis, 2D plots showing α-γ and ε-ζ angles are shown, with the MD simulation values in black, and the experimental values in red.
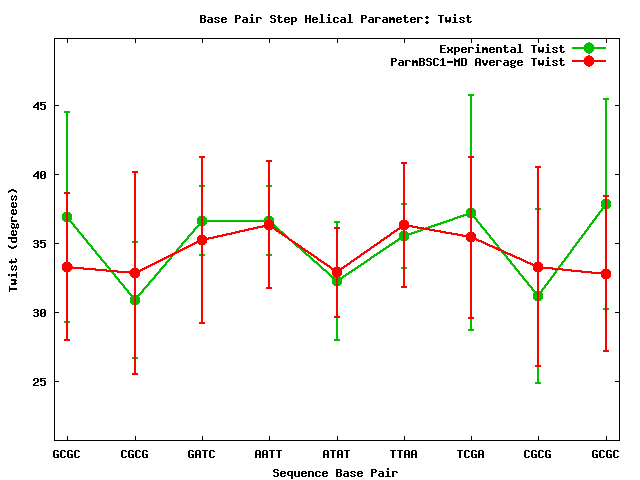
For the rest of helical parameters, two different information plots are generated. The first one is a comparison of average values for individual parameters, experimental versus simulated values, with their corresponding standard deviations (as both averages come from trajectories).
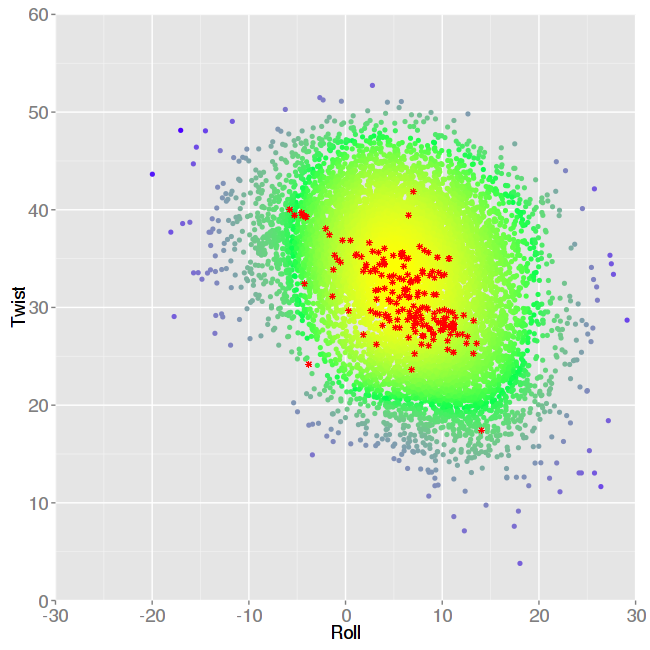
The second one is a comparison of average values for pairs of parameters, also experimental versus simulated values. In this case, information is shown in a 3D plot, where colors represent different densities, from higher density in yellow, to lower density in blue. Experimental values are shown as asterisks symbols in red color.