DNA & RNA Structure and Helical Parameters Analyses (NAFlex)
----Tutorial 2 -- Global analysis (XCGY)
Tutorial 3 -- Meta-trajectory (XCGY)
Tutorial 4 -- Experimental vs MD analysis
----This tutorial shows a brief example of information that can be easily extracted from the Global Analyses section of BIGNASim portal. For this short tutorial we have selected a very simple study that can be extended to a real and current research: the importance of flanking nucleotides in the flexibility of base-pair steps. The effect of the tetranucleotide environment in the sequence-dependent polymorphism of particular base-pair steps has been the target of recent studies. CG base pair step for example, shows an interesting bimodal behaviour in one of the six helical base-pair step parameters: Twist (P. Dans et al, NAR 2014). In this study, authors claim that the effect of the flanking bases in the CG base pair step is crucial for the existence of two different conformers: High Twist (HT: ~40º) and Low Twist (LT: ~ 20º). Different behaviors are studied and presented for each of the 16 possible tetramers including CG. From these, we chose a couple: ACGC showing almost no bimodality, and GCGA showing a clear bimodality, to illustrate the power of BIGNASim database and its interface. First step in this tutorial is going to the Search section of the portal. It can be accessed through the main menu:

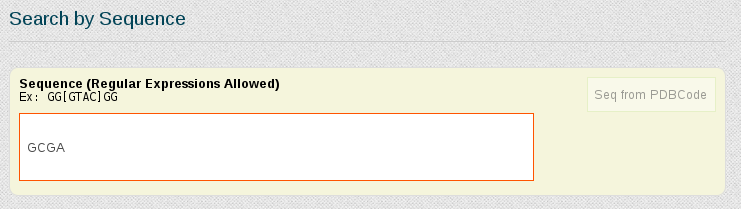
Once in the search page we are going to select all the simulations stored in the database having the first fragment of the pair we have chosen: GCGA. For that, we just type the letters of the nucleotidic fragment in the Search by Sequence area:
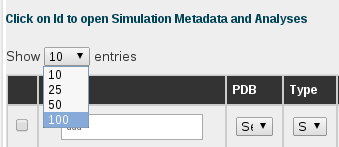
In this case, we have more than 40 simulations stored containing this particular fragment. Now, we can choose the ones we are interested in, or just select all of them. For that, the first thing is to show all the results on the screen, using the selector placed at the top left part of the browse page:
Then, with all the trajectories now shown on the screen, we can select them all by clicking at the checkbox placed in the top left part of the table, next to the Id title, or we can click at the Mark All button placed at the bottom of the page.
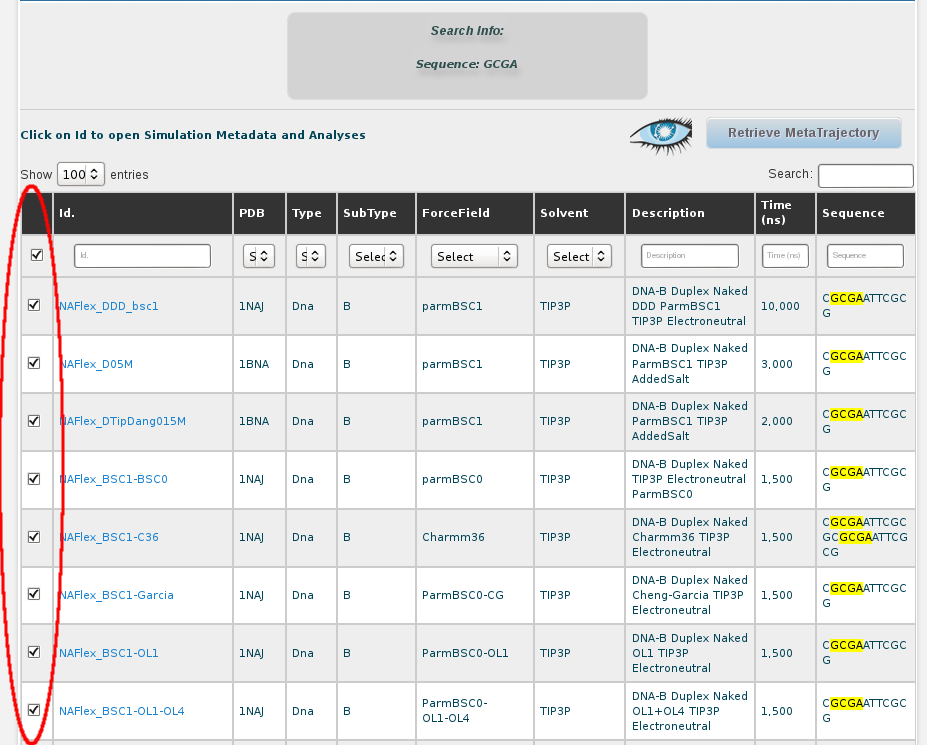
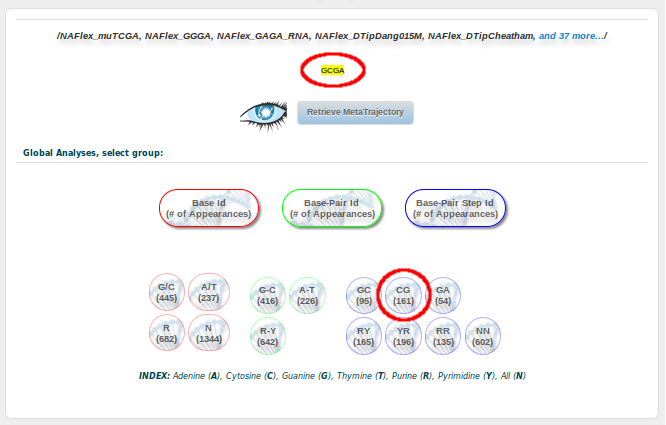
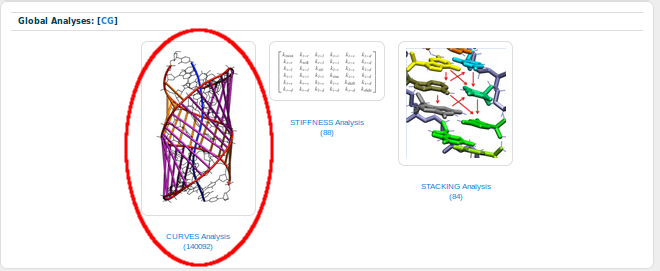
And finally, clicking at the Retrieve Analysis for the selected simulations at the bottom of the page, we will be redirected to a Global Analyses page, showing the results for our particular GCGA fragment. Now we are here, remember we are interested in studying the possible bimodality showed by the CG base pair step in its Twist parameter when it is surrounded by G and A (GCGA). Then, we need to select the CG button:
From all the possible analyses, we are going to chose Curves:
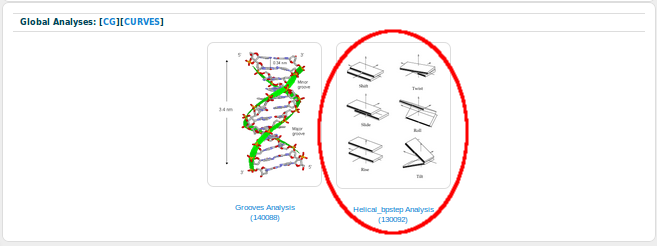
And, as the Twist parameter is a base-pair step analysis, we are going to chose Helical_bpstep Analysis:
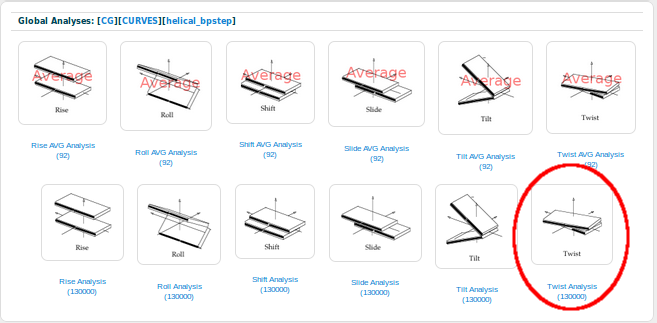
BIGNASim in its current version contains a couple of analysis for each of the six helical base-pair step parameters: one with all the values for each of the snapshots of all the selected simulations, and one with just the time-averaged values for each simulation. We are going to choose the one containing all the possible values for the Twist parameter:
And the result is presented in a histogram plot, with the mean represented in a vertical blue line, and an experimental value represented in a vertical red line, as a reference (see section Experimental Averages of this help).
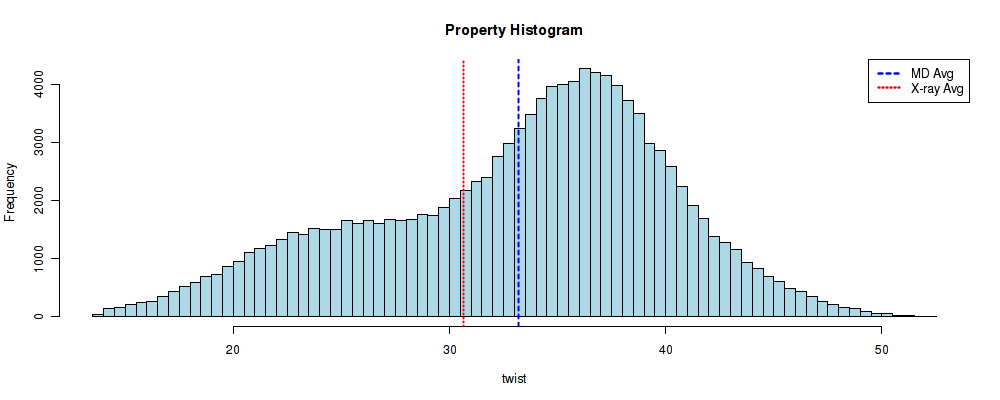
This histogram is certainly not following a normal distribution. Actually, two different distributions can be easily identified, centered at ~25º and ~35º, in good agreement with the previously presented study P. Dans et al, NAR 2014). But we are interested in seeing the influence of the surrounding bases in the CG base pair step (tetramer influence). So, for that, we are going to repeat all the steps, but now seeking for the fragment ACGC. Remember: Search by Sequence -> Select All -> Open Analysis for the selected simulations.
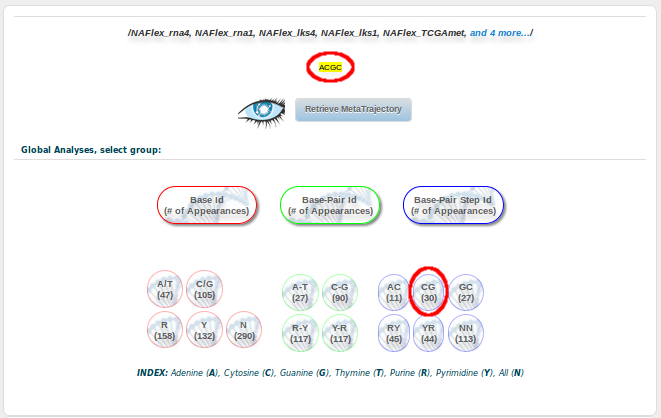
Once in the Analysis section: CG -> Curves -> Helical_bpstep Analysis -> Twist Analysis. And we should obtain a similar histogram than the previous one, now for the CG base-pair step into the ACGC tetramer:
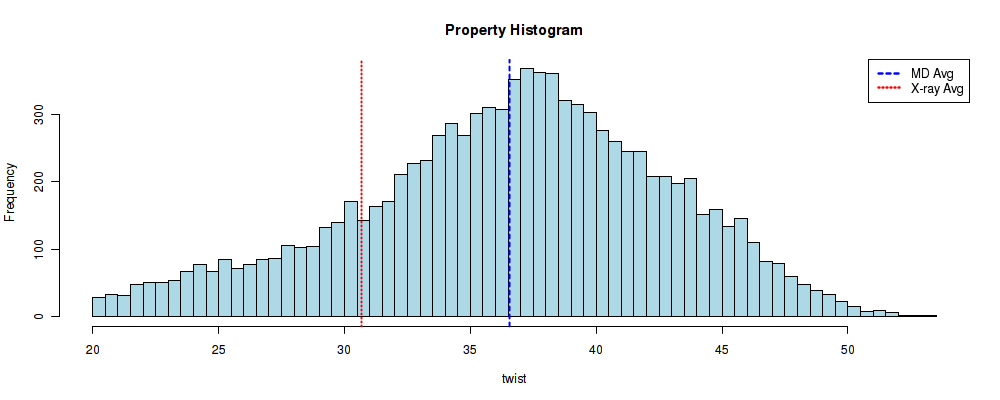
Now, this histogram do seems to follow a normal distribution, although a shoulder to the low twist conformation can still be identified. The difference between the previous plot and this one, though, are clear: CG base pair steps included in a GCGA tetramer show a clear bimodality in its Twist parameter, whereas the ones included in a ACGC tetramer are more inclined to be in a High Twist conformation. In this short tutorial, we have reproduced one of the results of a published research with just a few clicks. And this is just a brief example of what can be done with BIGNASim portal.